E-Books
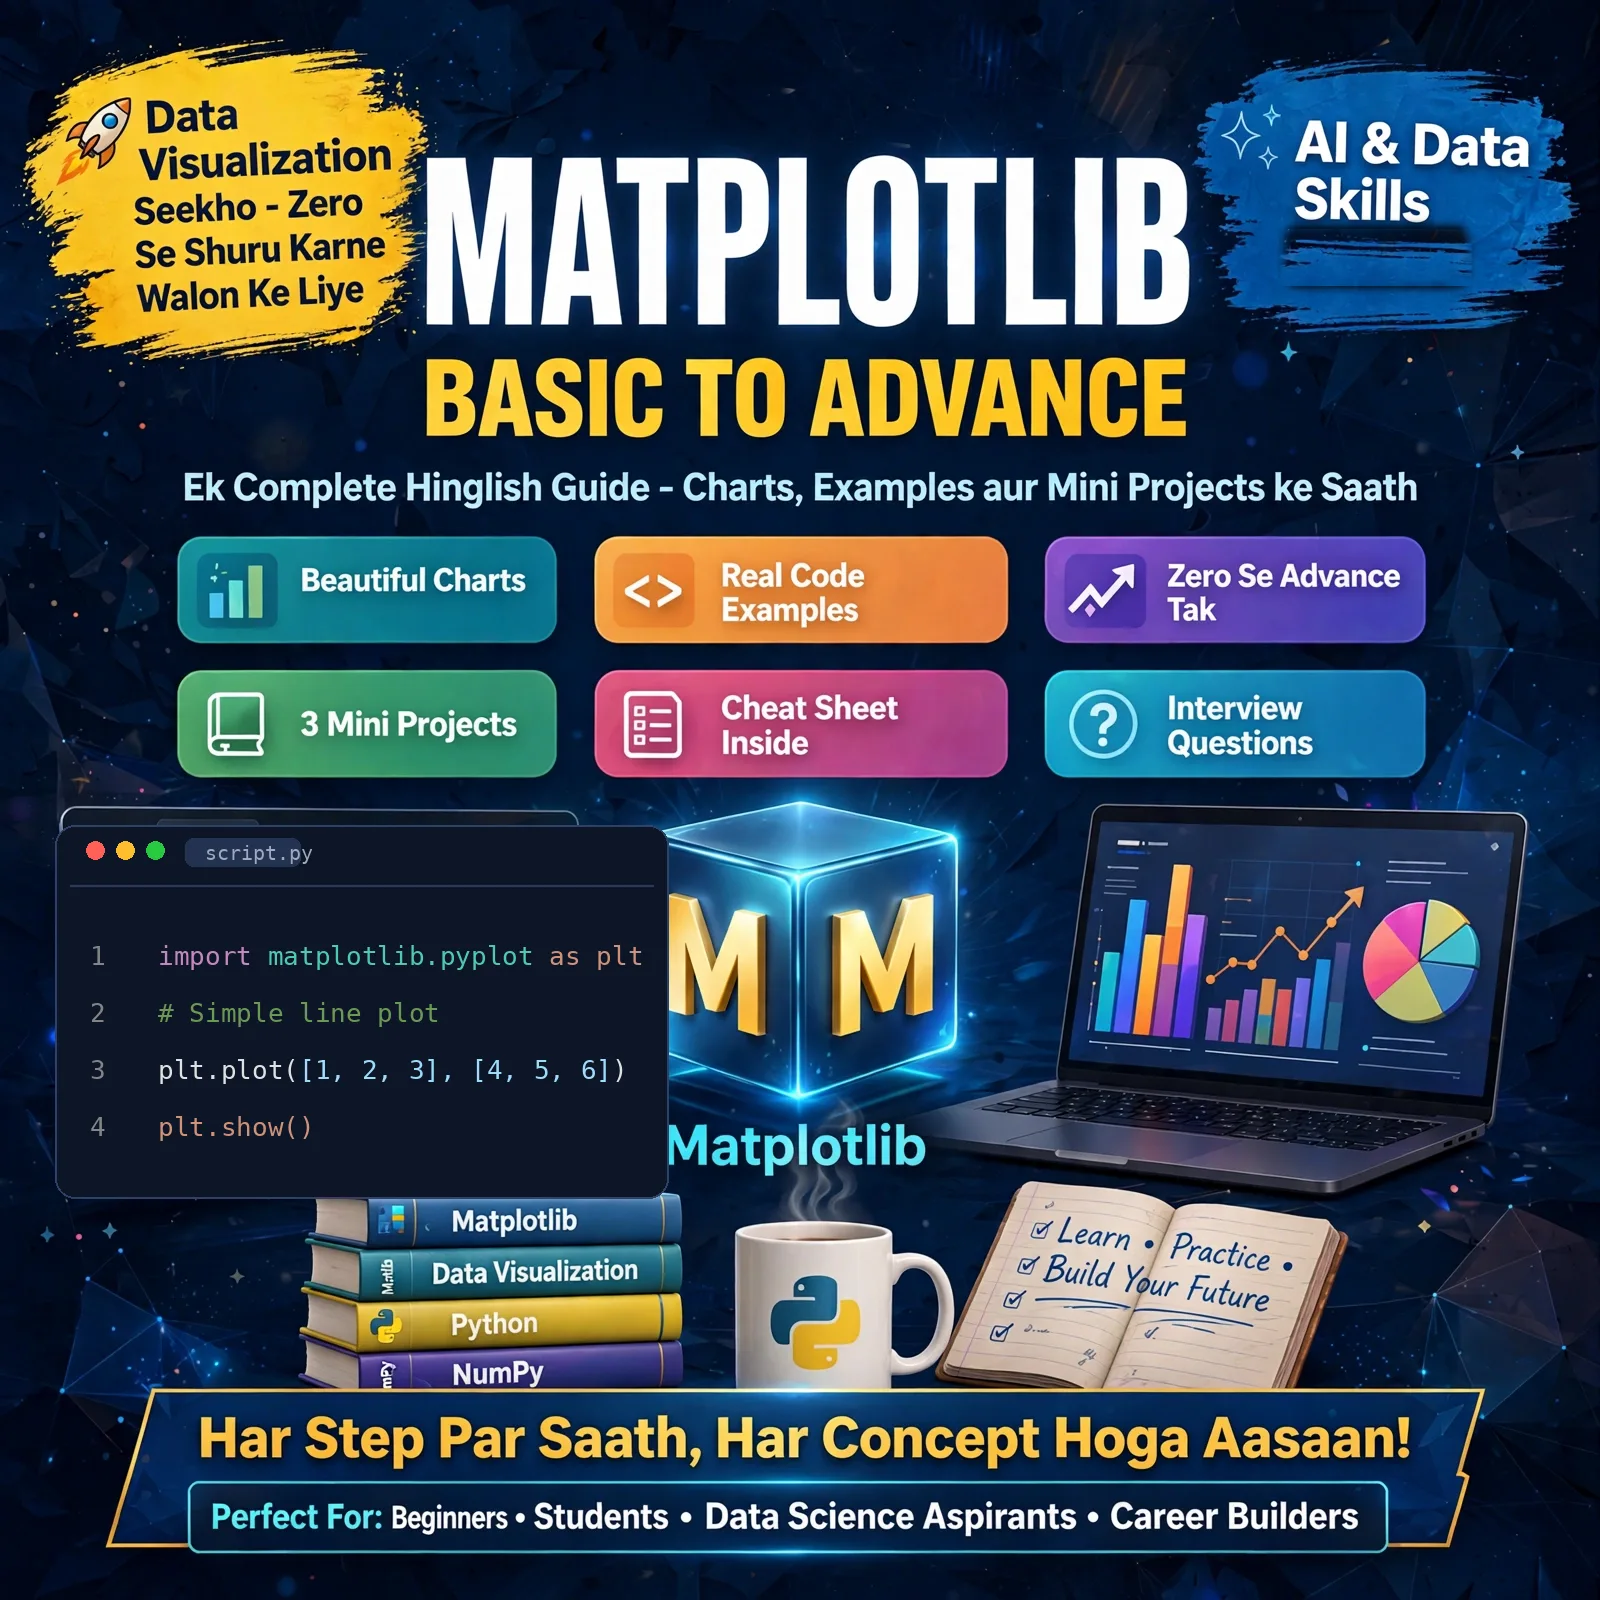
Matplotlib Basic to Advance – Complete E-Book: Learn Data Visualization with Python in Easy Hinglish (93 Pages, 20 Chapters)
4.6
(587)
₹179₹29940% off
Quantity
1
📥 Instant download after purchase — no shipping needed
Secure Payment
📊 Turn raw data into beautiful charts and graphs — even if you have never written a single line of code before. This complete 93-page Hinglish e-book takes you from your very first line plot all the way to 3D plots, animations and real mini projects, one simple step at a time.
📚 What's Inside the Book?
| Chapter | What You'll Learn |
|---|---|
| Chapter 1 | What is Matplotlib, how it works, installation & your first graph |
| Chapter 2 | Essential Python & NumPy basics: variables, lists, loops, functions |
| Chapter 3 | Line Plot — the most important graph, with titles, labels & legends |
| Chapter 4 | Customizing graphs: figure size, fonts, colors, styles & grids |
| Chapter 5 | Bar Charts — simple, horizontal, grouped & stacked |
| Chapter 6 | Histograms — bins, density & cumulative plots |
| Chapter 7 | Scatter Plots — bubble charts, colormaps & trend lines |
| Chapter 8 | Pie & Donut Charts with percentages and explode effect |
| Chapter 9 | Subplots — multiple graphs in one figure |
| Chapter 10 | Text, annotations, arrows & highlighting areas on graphs |
| Chapter 11 | Advanced charts: box plot, heatmap, contour, polar, violin & more |
| Chapter 12 | Object-Oriented method: twin axes, GridSpec, log scale, date axis |
| Chapter 13 | Colormaps, themes & global settings (rcParams) |
| Chapter 14 | 3D Plots — lines, scatter, surfaces & camera angles |
| Chapter 15 | Saving your figures in different formats |
| Chapter 16 | Animation — moving graphs & saving them as GIF |
| Chapter 17 | Matplotlib with Pandas — df.plot() & CSV data plotting |
| Chapter 18 | 3 Mini Projects: Sales Dashboard, Student Result Analysis, Expense Tracker |
| Chapter 19 | Common errors & their solutions + 3 golden debugging rules |
| Chapter 20 | Best practices, cheat sheet, practice assignments & interview questions |
✅ Why You'll Love This E-Book
- ✔ Written in easy Hinglish — perfect even if you are an absolute beginner
- ✔ Every concept comes with ready-to-run Python code and its actual output graph
- ✔ 3 complete mini projects that combine everything you learned
- ✔ Quick cheat sheet of the most important commands
- ✔ Practice assignments to test yourself after learning
- ✔ Interview questions to prepare for data-related jobs
- ✔ A full chapter on common errors and how to fix them
🎯 Who Is This For?
Students learning Python and Data Science, complete beginners who have never coded before, and anyone who wants to create professional charts and dashboards for college projects, freelancing or job interviews.
📥 Digital E-Book
This is a digital product — you receive the complete 93-page PDF e-book file. No shipping needed, read it on your phone, tablet or laptop.
🚀 Start making graphs like a pro today — your data visualization journey begins here!